The idea
Every evening the same roads back up, and Waze knows it block by block. I already had the other half sitting on a shelf: an isometric St. Louis redrawn as a little toy diorama, the same downtown and the same river crossings, small enough to hold on one screen. I wanted the two married together — real congestion crawling across the toy, the jam you are sitting in glowing red on a city you can take in at a glance.
The catch: it's a drawing, not a map
A normal traffic map is easy, because the map is made of coordinates to begin with. Mine is not. The diorama is a picture, redrawn one block at a time by an image model, and there is no latitude or longitude anywhere inside it. It is also worse than a flat overhead map, because the city was captured at a 45-degree tilt, so it is not a plane you can scale a grid onto. Before I could drop a single Waze jam in the right place, I had to teach the picture where its own streets live.
The close-but-wrong version
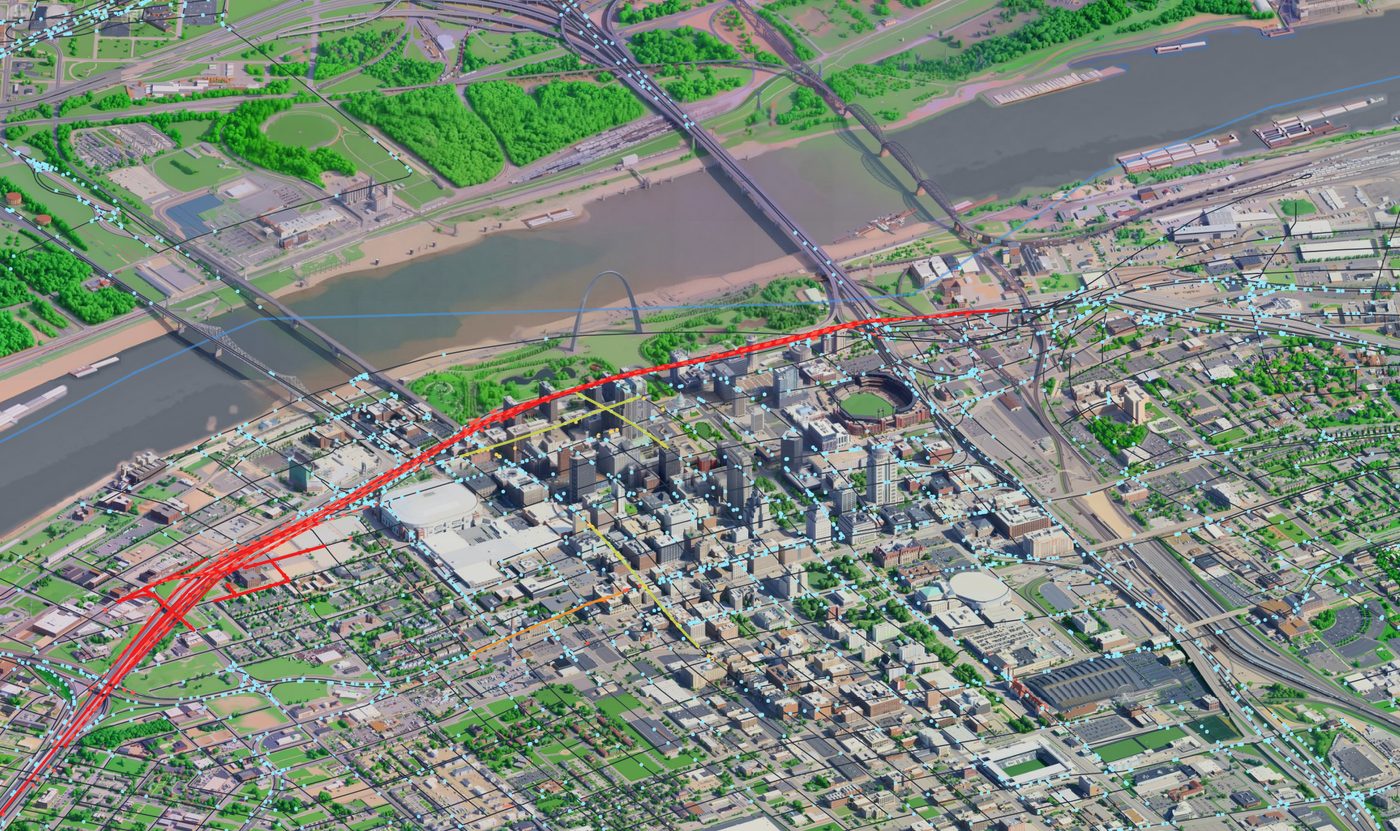
The first attempt was the textbook one. I gave myself a handful of knobs — rotate the grid, scale it, squash it, slide it around — and tuned them by hand until downtown clicked into place. A hand-tuned fit can only ever be right in one spot, so I let the computer solve the best single transform instead: the six numbers of an affine fit against the landmarks all at once.
Downtown looked perfect either way. Then I checked the bridges and the north end, and they had wandered well off their streets. One flat transform can be exact in a single spot or loosely right everywhere, never both, because the capture is not really a plane. The best it could hold downtown was about 22 pixels of slop — good there, and visibly wrong out at the edges.
The fix: bend the world to fit the drawing
The answer was to stop forcing one rigid transform and let the map flex. A thin-plate spline is the math version of a thin sheet of metal pinned down at a few points: it passes exactly through every pin and curves as gently as it can in between. So I pinned real landmarks to their spots on the drawing — the Arch, the stadium, the bridge ends — and ran a spline through them.
Now the centre stays locked, and a pin way out by I-70 can pull its own corner back into line without dragging downtown along with it. Every pinned landmark lands to the pixel, and the roads between them follow the curve. The page ships pre-bent, with the finished warp baked in as the default.
Pinning it by hand
Ten named landmarks were not enough to settle the far corners, so I built a second tool. Grab any road on the map, drag it onto where it actually belongs, and let go to drop a free pin right there. Between picking landmarks off a list and shoving roads around by feel, the warp ended up resting on dozens of pins — a handful of real landmarks and a long tail of freehand nudges, then exported and frozen into the page.
Measuring how good it is takes a little care, because a spline fits its own pins perfectly by definition, so the error on those pins is always a meaningless zero. To get an honest number I held each pin out one at a time, rebuilt the warp without it, and checked how far off it guessed the one I hid. That leave-one-out check is the only accuracy worth quoting on a thing built to nail its own training points.
0 px
error on every pinned landmark · honest accuracy measured leave-one-out
The live feed
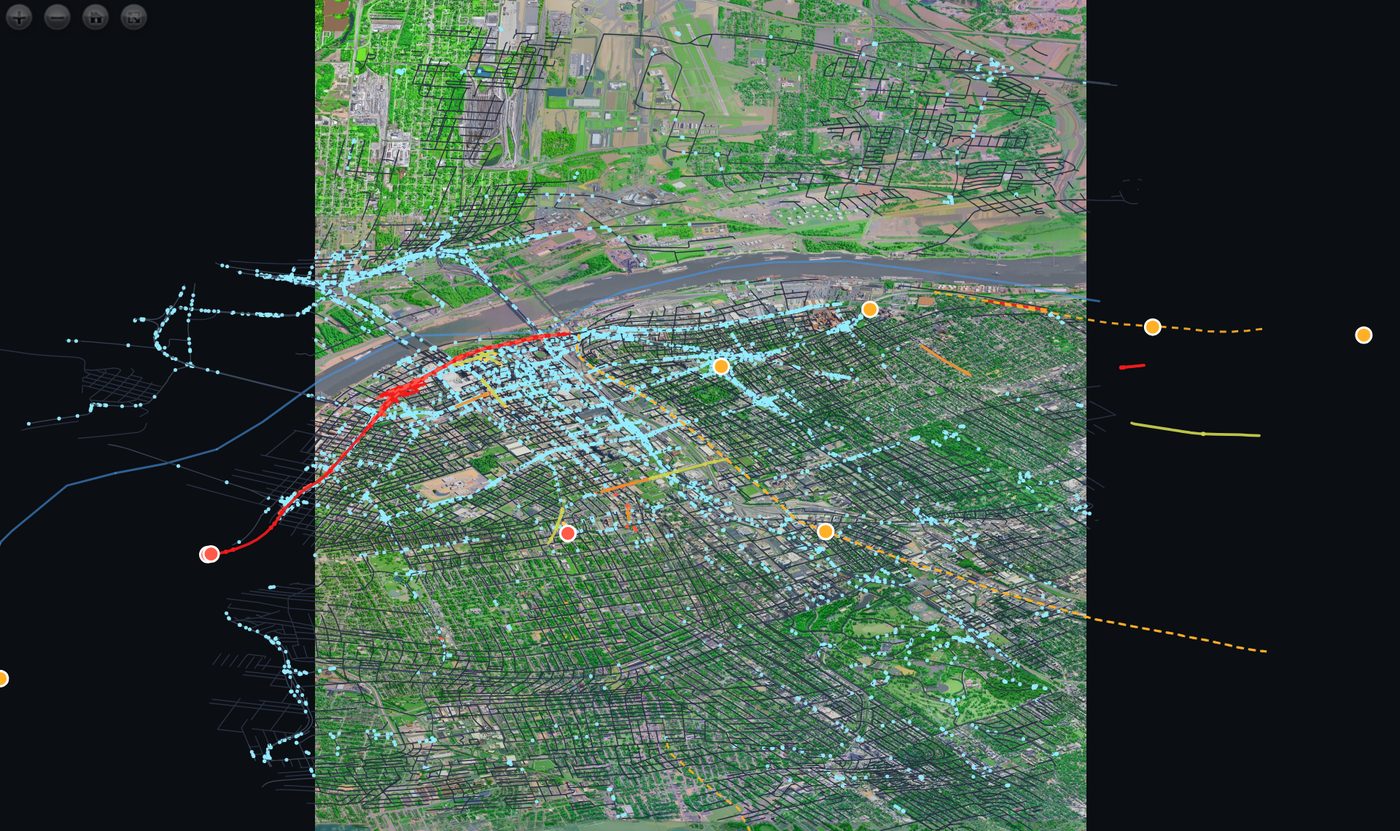
With the alignment solved, the traffic itself is the easy part. A live Waze feed arrives about once a minute as jams and alerts — the police sightings included — and Missouri DOT's own incident feed comes in on a slower clock alongside it. Roads run green when they are flowing, amber as they slow, and red where everything has stopped.
Small cars drive along every street so the city feels alive even where nothing is wrong, and the real jams paint over them in red wherever Waze says it is bad. If the live feed ever hiccups the cars keep moving, so the map never falls dead, and there is a demo mode you can flip on to watch invented jams roam the grid. A hook stays open too, so another app can push its own traffic straight onto the streets.
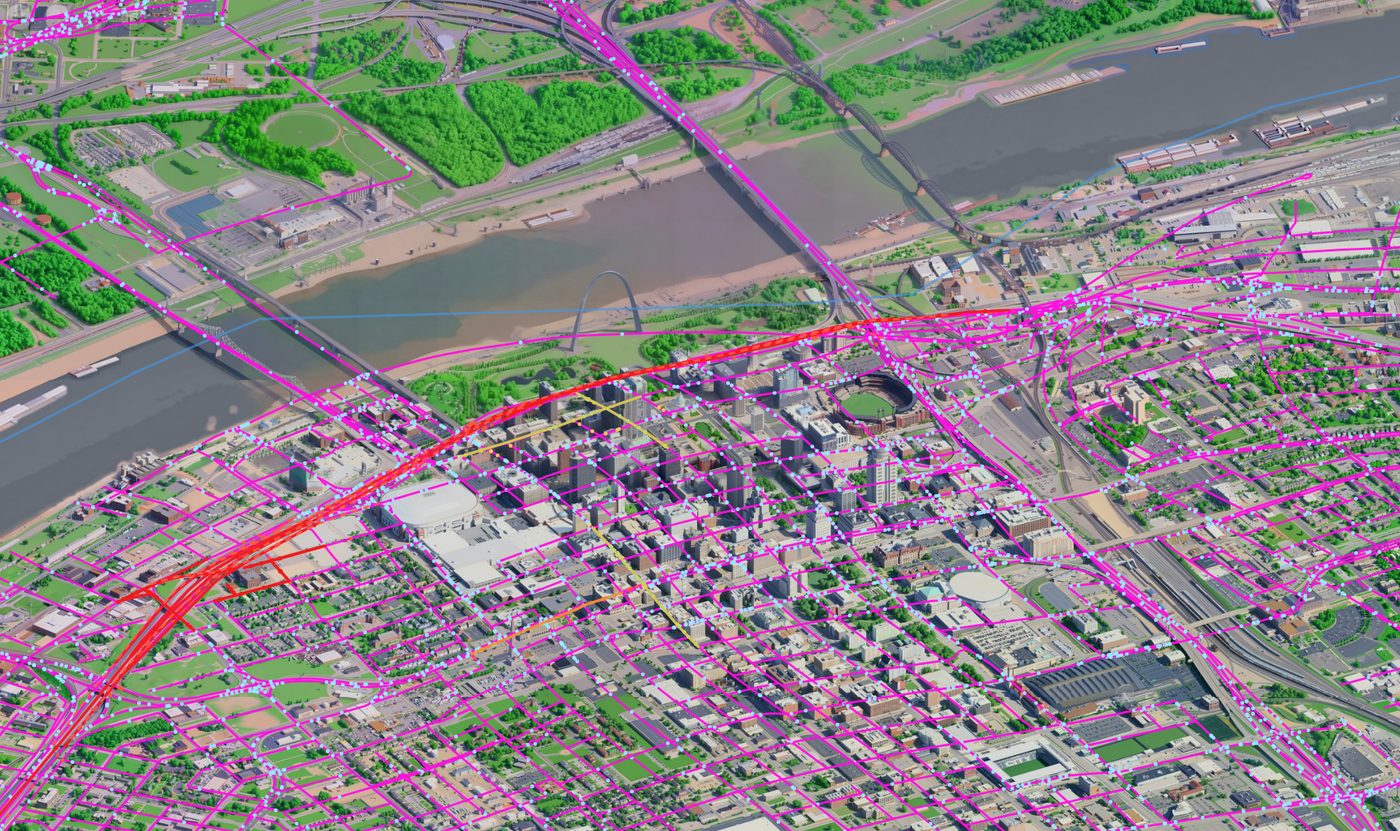
From the corridor to the whole footprint
The first build covers the stretch I care about most: the 2,934 streets of downtown and the river crossings. The wider build paints the entire drawn footprint instead — over 4,600 streets reaching out into the west, south and north of everything that has been drawn so far. Same warp, same feed, just a lot more road.
Where it stops, and why
Here is the honest limit. The traffic layer is ready for the whole city right now. Trouble is, the city isn't drawn yet. The diorama only exists for downtown and the core, because every block of it has to be redrawn by the image model, and rebuilding the full City of St. Louis at that quality costs real time on a serious GPU.
So the traffic stops where the drawing stops. With funding, or access to a big graphics card, I finish the map, and the congestion spreads to every street in it the same day the art lands. Until then, this is how far the toy reaches.