What it is, and what it isn't
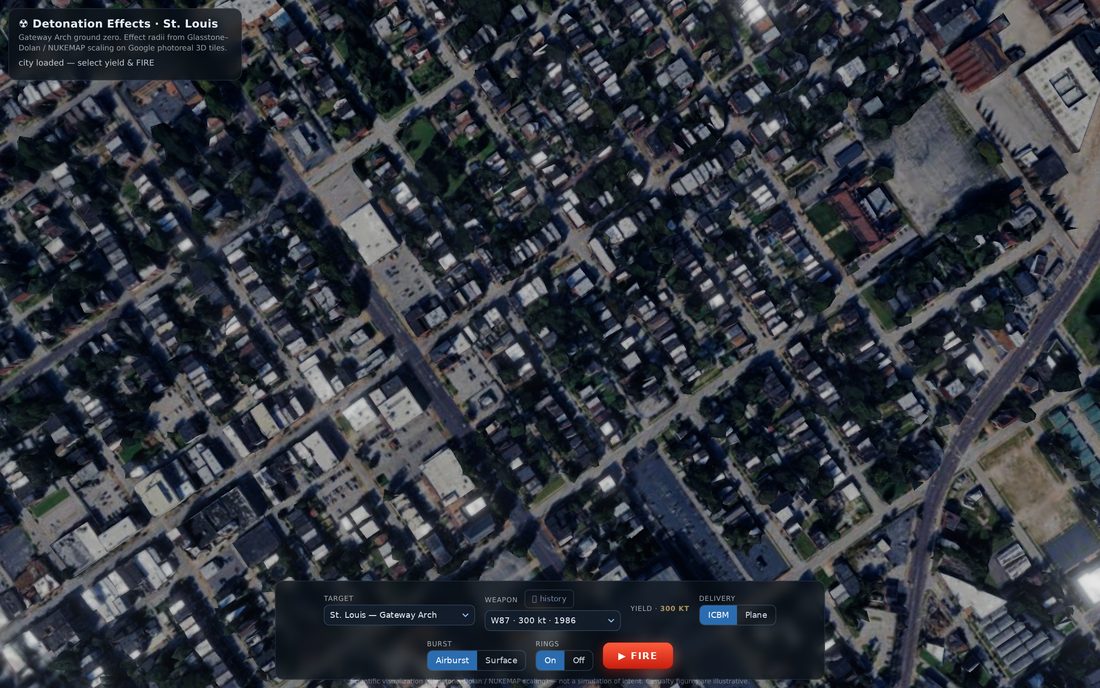
It is a detonation visualizer that runs over a photoreal 3D city. You choose a target, a real city with a real landmark as ground zero, then a weapon, either one of a dozen historical warheads or a custom yield off a slider, and it shows you the science-scaled footprint: overpressure that flattens buildings, the heat that burns at a distance, the cloud, and on a ground burst the fallout drifting downwind. It defaults to St. Louis with the Gateway Arch as the aiming point, because this is a St. Louis site and the whole thing started as one more way to look at the city.
It is not a forecast, and it does not pretend to be. The casualty numbers are labeled illustrative everywhere they appear, because real casualties depend on shelter, time of day, weather and warning in ways no toy can know. What it can do honestly is the geometry: where the rings fall, how big the cloud gets, roughly how many people live inside each ring. Everything here is built on published, decades-old, unclassified physics, the same reference work the well-known online blast maps use.
Twelve real warheads
The arsenal is twelve actual weapons, each with its real yield and date and a short museum history. Little Boy and Fat Man are both here, the two that were ever used in anger. So is the Davy Crockett, a recoilless rifle that lobbed a sub-kiloton warhead, almost comically small on the same scale. The big Cold War hydrogen bombs are in too, Castle Bravo and the Tsar Bomba, alongside a few modern warheads still in service. I fact-checked every figure against the nuclear weapon archives, and the histories carry the real, strange details: Castle Bravo came in two and a half times bigger than its designers predicted because they had miscounted which form of lithium would burn, the Tsar Bomba was deliberately throttled from a hundred megatons to about fifty by swapping in lead so it would not blanket the planet in fallout, and Little Boy actually split less than two percent of its uranium.
Yield is the lever you feel most. The smallest weapon here barely scratches a few blocks; the largest would put its cloud into the stratosphere and reach for fallout across whole states. Watching the rings jump as you step up the scale is the part that makes the numbers land.
The rings are not decoration
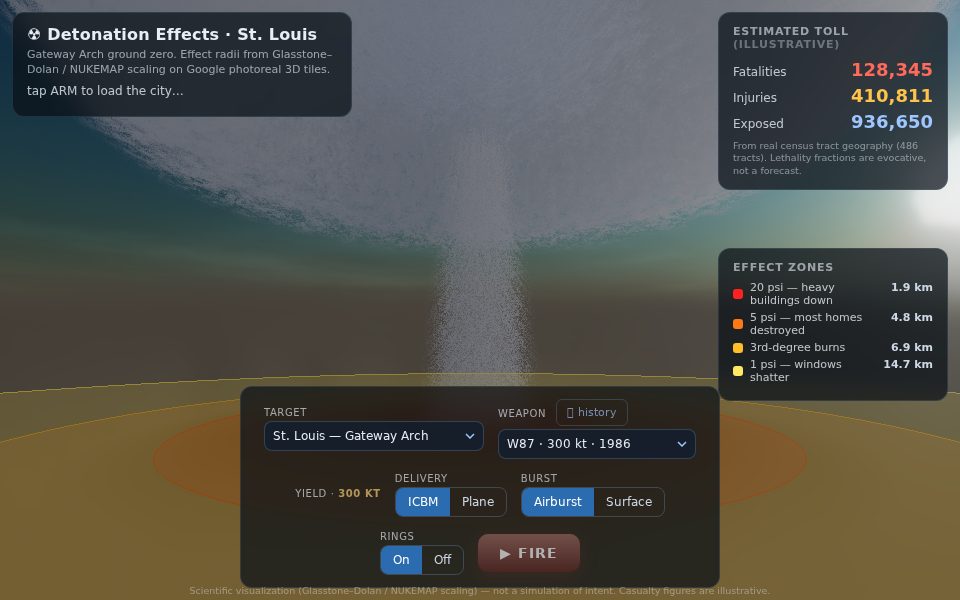
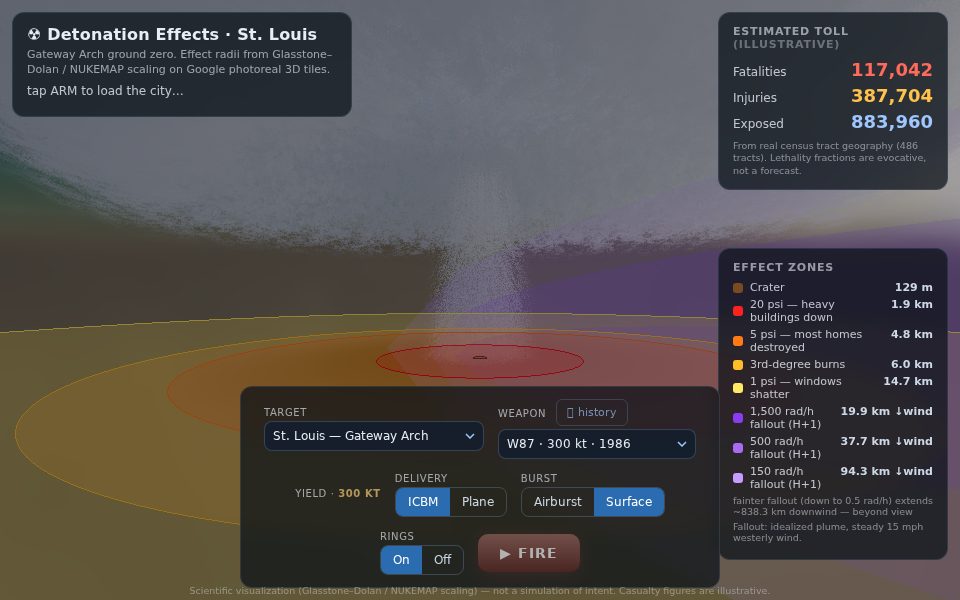
Each colored ring is a real effect at a real distance, not a vibe. The blast rings come from the standard cube-root scaling: the radius of a given overpressure grows with the cube root of the yield, with a constant for each level that I tuned until my rings matched the published reference table to within a couple of percent. Twenty pounds per square inch is where heavy buildings come down, five is where most houses are destroyed, one is where windows shatter blocks and blocks out. A separate set of rings is the heat, the distance at which the flash gives third-degree burns, and on a clear day that burn ring usually reaches past the five-psi blast ring, which surprises people. On a ground burst there is also a crater.
The legend down the side spells out every ring in plain language and in kilometers, so the abstract circles tie back to something you can pace off. That was the goal of the whole exercise: a circle on a map means nothing until it has a number and a sentence attached to it.
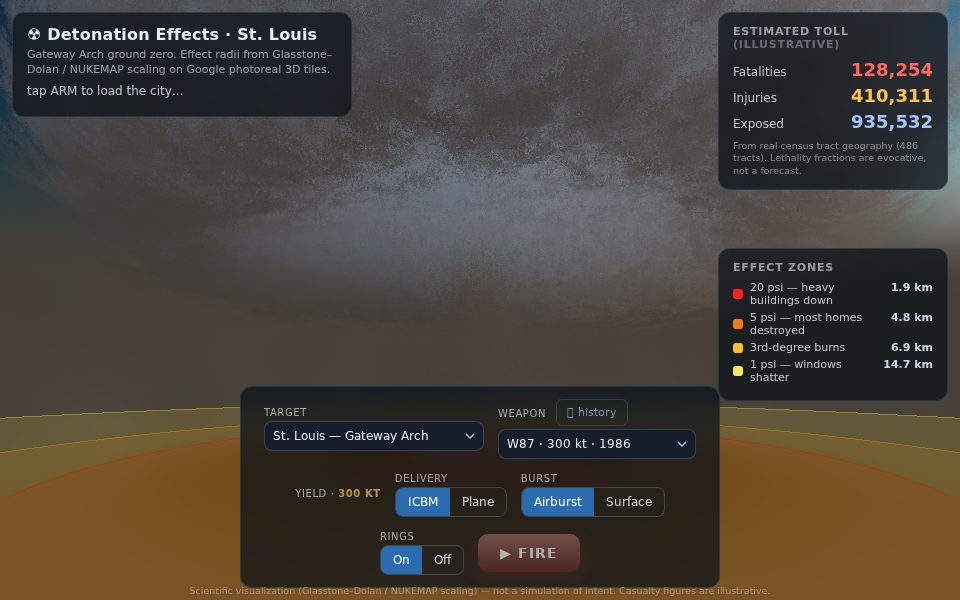
One cloud, locked to the math
The mushroom cloud is the showpiece, and the thing I am proudest of is that it is not faked separately from the numbers. The same formula that sets the rings sets the cloud: the height it tops out at and the width of the cap both grow with the yield by the same published relation, and that single set of figures drives the cloud you see, the rings on the ground, and even how far the camera pulls back so the whole column stays in frame. A small weapon makes a small cloud the camera stays close to; a megaton weapon throws a column the camera has to retreat from. The visual and the physics never drift apart, because they are reading from the same source.
Under the hood the cloud is two things at once. There is a particle simulation of a vortex ring, a thin stem flaring into a torus that rolls up and over itself the way a real cap does, glowing hot at the base and cooling through an angry brown to white smoke as it rises. Layered with that is a volumetric cloud raymarched in the shader for the soft, lit body. On a phone it falls back to just the particles, because the volumetric one is expensive.
The fallout that came out twenty times too small
This was the longest fight, and a good lesson in reading a table before you trust it. Fallout is the hardest effect to get right, because it depends on the wind, on how much of the yield came from fission, and on a set of scaling laws buried in the reference work. My first version drew plumes that were laughably small, an entire build where a megaton ground burst dropped a smudge of fallout that should have stretched for a hundred miles.
The bug was that I had misread the table. Its rows are not fixed distances for a one-megaton bomb, the way I first took them; they are scaling laws, a coefficient times the yield raised to a power, that you evaluate for whatever yield you actually have. Read the wrong way, every plume came out eleven to twenty-two times too short. A careful re-reading of the table, line by line against the book's own worked example, fixed it. There was a second trap hiding behind the first: the direction of the fission correction was ambiguous enough that three readings of the same paragraph gave answers a factor of two apart, and only checking it against the book's solved problem, a ten-megaton, half-fission burst in a thirty mile-per-hour wind, settled which way it went. The rule that fell out is the tidy one: less fission means less fallout. The model now lands within about ten percent of the book's own numbers, and on a real megaton ground burst the dose contours reach so far downwind that the legend has to note the rest runs off the edge of the view.
Counting it in people
The number that makes the simulation land is the toll, and it is built from real geography. For the cities that have the data, the country is carved into census tracts, each a small neighborhood with a known population, and the model walks every tract whose center falls inside the expanding shock front, adding up the people and applying a rough fatal-or-injured fraction by which ring they sit in. St. Louis alone is around five hundred tracts. The counter climbs as the blast wave sweeps out, so you watch the toll accrue in the seconds after the flash rather than just reading a final figure.
Getting the population data turned into its own small project, because the official census endpoint started requiring a key. Rather than depend on that, the tract populations and their center points are pulled from the public census gazetteer and the open community census service, no key needed, and baked into a file per city. Cities without a tract file fall back to a smooth population-density estimate, so the toll is always a guess of the right size even where the fine data is missing. And it stays labeled a guess. The fractions are deliberately evocative, not a claim.
≈ 500 tracts
St. Louis, real census geography · toll climbs with the shock front · illustrative, not a forecast
Getting it there
A warhead has to arrive, so each one does, with a short flight you can watch or skip. A bomber flies a level run and releases a gravity bomb that falls away on a forward arc; a submarine missile comes in on a depressed ballistic trajectory from offshore; the little artillery shell lobs in close. The camera tracks the falling weapon so the burst happens where you are already looking, and a countdown in the status line tells you how long until impact. None of this is a full flight simulation, just honest, scripted arcs with the real cruise speeds and altitudes feeding the timing.
The delivery aircraft are drawn as distinct silhouettes rather than one generic plane, built from a few parameters each, so a propeller-driven bomber from the forties reads differently from a swept-wing jet or a flying wing. It is a small touch that costs almost nothing and makes the right machine show up for the right weapon and era.
The bugs that fought back
The flat blast rings kept getting chewed to pieces. Drawn as discs lying on the photoreal city, they let the buildings and the hills poke through them, so a clean circle came out shredded wherever a tall building stood. The fix was to stop letting the city occlude them and draw the rings straight over the top, since they are a diagram, not a physical object sitting in the street.
The camera flickered at city scale until I retuned how near and how far it was willing to draw, a classic case of the close and distant limits being set so far apart that the depth math ran out of precision. And the automated screenshot tests that I lean on to catch breakage kept failing for no reason, until I realized the headless browser runs the simulation at roughly half real speed under load, so a fixed wait was landing right on the edge of a delivery arc; nudging the wait longer fixed a bug that was never in the simulation at all, only in the clock I was measuring it with.
Arm before it bills
The photoreal city is the one expensive ingredient, because those streamed 3D tiles are metered. So nothing loads until you say so. The page opens on a single dark screen with one button, and only when you arm it does it begin pulling the city, which keeps the meter at zero for anyone who lands on the page and leaves, and for every bot that crawls it. Reset after a detonation tears the show down but keeps the tiles already loaded, so playing again does not quietly re-bill the whole city. Small discipline, but it is the difference between a page you can leave public and one you cannot.
Where it's going
There is a second version of the cloud I have been picking at off to the side, chasing realism the shipped one does not have yet: a condensation skirt sliding down the stem, lightning flickering in the crown on the truly enormous shots, the cap glaciating into ice as it tops out, and the cloud lit with a sunlit and a shadowed flank instead of one flat tone. The bigger addition is sound, the flash and then the boom arriving a beat later at the speed of sound, with a long rumble after. None of that is in the live page yet; it is the next thing to judge, in a browser, the way everything here gets judged before it ships. For now the version you can fire is the one that gets the physics right and keeps the picture honest, which was always the part that mattered.